Free tool
Sponsored post rate calculator for Instagram, TikTok and YouTube
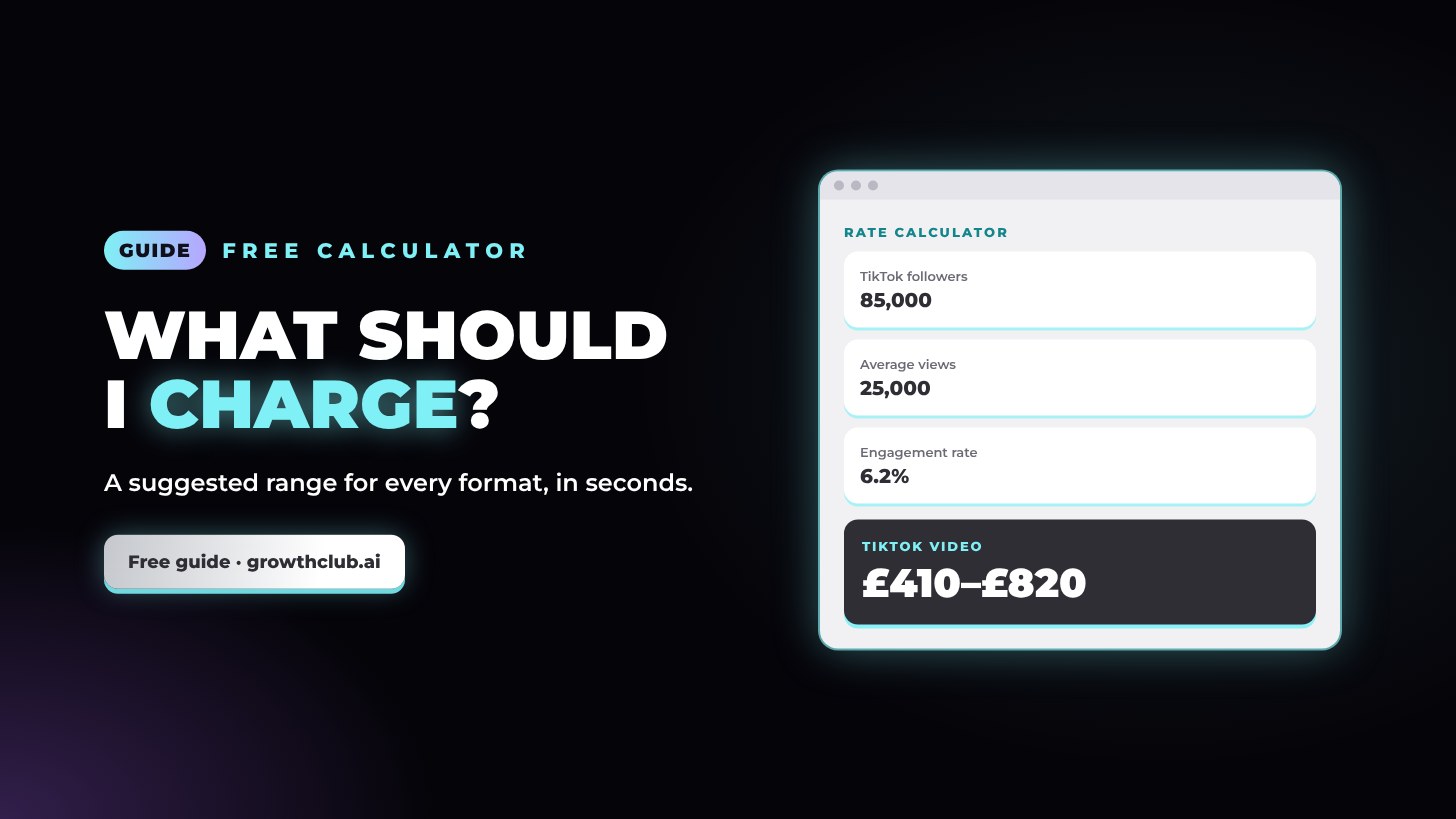
Enter your followers, average views and engagement rate below to get a fair starting range for a sponsored Instagram Reel, a set of Stories, a TikTok video and a YouTube integration. The calculator blends your audience size with your actual views and adjusts for engagement, using the same method as the suggested rates in Brand Deals HQ. Use the result as a starting point, then adjust for your niche and what the brand wants.
How the calculator works
It suggests a low and a high figure for each format:
| Format | How the range is worked out (in £) |
|---|---|
| Instagram Reel | £8 to £15 per 1,000 followers |
| 3 Instagram Stories | £3 to £6 per 1,000 followers |
| TikTok video | The higher of £12 to £25 per 1,000 average views, or £4 to £8 per 1,000 followers |
| YouTube integration | The higher of £20 to £40 per 1,000 average views, or £15 to £30 per 1,000 subscribers |
If you leave average views blank, it assumes 20% of followers for TikTok and 15% of subscribers for YouTube. Engagement of 6% or more adds 20%, 3% to 6% leaves it unchanged, and under 3% takes off 15%. Currency: US dollars are about 1.25 times the pound figures and euros about 1.15 times. Every result is rounded and never goes below 50.
For comparison, published 2026 benchmarks suggest about $10 per 1,000 followers as a starting point for Instagram and TikTok, and CPMs of roughly $15 to $45 for Reels, $7 to $25 for TikTok and $15 to $35 for YouTube integrations (Hootsuite, Modash). The calculator’s top figures can sit above these, so sense-check your result against them.
When to charge more than the calculator says
- High-value niche: finance, tech, software, B2B and luxury often support CPMs well above average. Finance promotions also come with extra legal rules (in the UK, most investment and crypto promotions need approval from an FCA-authorised firm), so check before you say yes.
- Strong results: proof of sales, codes used or link clicks from past campaigns.
- Extra work: scripts, locations, props, travel, multiple revisions.
- Usage, exclusivity or rush: charged on top. See usage rights pricing.
- Peak season: Q4 and big launches.
When to come in lower
- Your recent views are well below your follower count suggests.
- It’s a first deal with a brand you really want long term, and they’re offering a multi-month plan.
- The brief is light (for example, Stories only, no script).
Rather than discounting, consider offering a smaller deliverable at your normal rate. See how to negotiate brand deals.
Add your followers, average views and engagement once, and Brand Deals HQ suggests a starting range for every format, ready to drop into a pitch.
Create my account and try itIt’s free with a Growth Club account.Frequently asked questions
How accurate is an influencer rate calculator?
It gives a fair starting range based on your audience, views and engagement. Real deals vary by niche, brand budget, usage rights and the work involved, so use it as a starting point, not a fixed price.
Why does the calculator ask for average views?
Because views show how many people will actually see a sponsored post. On TikTok and YouTube especially, views say more than follower count, which is why the calculator uses the higher of a views-based and a follower-based figure.
What engagement rate should I enter?
Your average engagement over recent posts. Not sure? Work it out with the engagement rate calculator.
Does this include usage rights?
No. The results are for content posted on your own channels. Charge extra if a brand wants to run your content as ads, usually 20% to 50% of the fee per month.
Good to know: this guide is general information, not legal, tax or financial advice. Rates and earnings are estimates, not promises, and platform rules change, so check the official pages we link to. Instagram, TikTok, YouTube, Facebook, Threads, X, LinkedIn and the other names mentioned are trademarks of their owners; Growth Club isn’t affiliated with or endorsed by them.